Freixenet’s mission statement is to “Celebrate all life’s moments,” but in this case study with Enolytics it was able to use real time consumer data to better understand how and why its consumers are celebrating those moments with Freixenet over another bottle of sparkling wine or cava. Enolytics founder, Cathy Huyghe, explains how the study worked.
Wine consumer data has emerged as one of the most dynamic and exciting areas of interest in the industry today. All types of businesses – including producers, restaurants, analysts, and data providers themselves – are fueling its growth, with the ultimate aim of better understanding consumer behavior and sentiment in order to deliver better service and, of course, sell more wine.
It’s still a relatively new endeavour. It’s helpful, then, to pause and examine the actual nuts-and-bolts of a project, from a profile of the client through to how that client will apply the insights they’ve learned.
Freixenet is keen to use more consumer analysis to better understand how its customers are using the sparkling wine category
The Opportunity
With a company history dating back to 1914, when the first bottle of Freixenet was released in Spain, Freixenet has developed into an internationally iconic producer of sparkling wine, or cava. Its US division enlisted Enolytics for a benchmarking study earlier this year, in order to gain insight into consumer behaviour and sentiment around the sparkling wine category within the US, with drill-down into the sub-categories of Spanish Cava, Italian Prosecco, California sparkling wine, and French Champagne.
How We Did It: Methodology
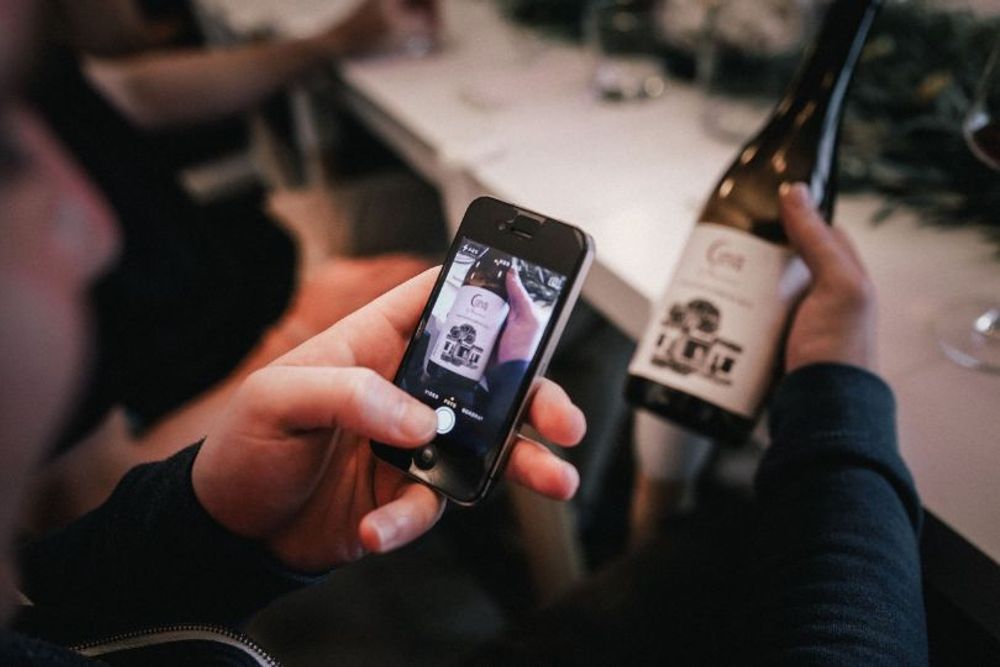
Enolytics took consumer search data for Freixenet and sparkling wines from the Vivino wine app to help analyse how consumers are shopping the category
As with each of our projects, Enolytics began with a raw data set from partners who are selected because their data is best suited to address our clients’ concerns. Since the Freixenet project was primarily consumer-focused, we partnered primarily with Vivino, the online wine sharing, comparison and now sales app, for its raw data and the significant size of its footprint; Vivino is the world’s most downloaded wine app, with more than 24 million downloads worldwide. A typical data set for a US-focused study measures ca. 500,000 records or more, and our analysts overlay (or aggregate) those records with data from additional sources that are publicly available (such as US census data) as well as other wine-focused platforms.
Our team of data scientists then build an interactive dashboard that visualises prioritised fields and KPIs. Since the team at Freixenet USA who are dedicated to this project are technologically savvy and familiar with analytics platforms, they chose to access the dashboard themselves in order to explore the data and “slice and dice” it as their understanding evolves. Sometimes clients also ask us for more static reports that include an actionable summary of our findings, but Freixenet wanted to explore the data themselves and at their own pace.
Key Conclusions
“We have found the data to be very useful in getting an understanding of our consumer and their perception of our brands and individual SKUs, spotting opportunities geographically (especially important for our direct to consumer business), and confirm (or surprise!) our assumptions about the sparkling wine categories,” says Danielle Fritz, brand manager for Freixenet USA.
Four of the key takeaways from the project included:
- A better understanding of the consumer demographic where Freixenet brands over index, within a 10-year age bracket and $10k income bracket. This was broken down by Freixenet labels, i.e., Gloria Ferrer vs Segura Viudas vs Freixenet.
- The specific markets where Freixenet brands own greater and lesser shares of consumer interest. That is, where those brands are doing well and where there’s room for improvement, relative to consumer behaviour and interest. Also the geographical biases toward one category of sparkling wine over another.
- The key words that consumers consistently use to describe each brand, which also leads to insights about the occasions when the brands are “in use” by consumers, such as special occasions and weekend brunch.
- Gauging the potential of whether or not to raise the prices of their wines, particularly in relation to other Spanish Cava wines.
Processing these takeaways, especially to the detail that the data allows, opens up a wealth of strategic possibilities for Freixenent and their marketing and sales teams. Studying consumer data also gives them a competitive advantage over their peers, as well as a baseline against which to measure their initiatives in the coming months and years.
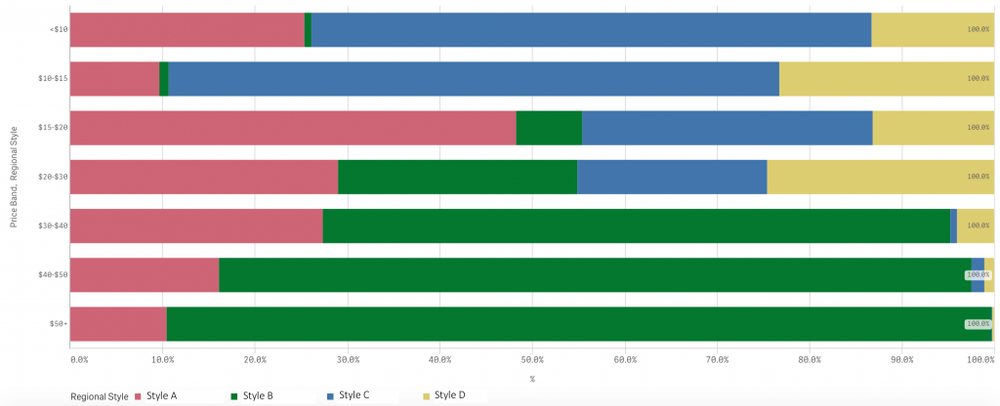
The above chart breaks down distribution of sparkling wine styles in the US according to price ranges across Cava, Prosecco, Champagne and California sparkling wine.
Enolytics: what we learned…
Enolytics launched 18 months ago and, even within that short timeframe, we’ve seen an evolution of understanding about how Big Data can be used within the wine industry, particularly to understand consumer behaviour better. Hand-in-hand with that understanding is a clearer perspective on what our network of data partners offers. Each partner has their own personality. The architecture of each partner was built differently, with different priorities. Which means that each partner, and each data set, contributes a unique piece to the puzzle of consumer behaviour.
It’s important to note that, since working with consumer data is still a fairly new concept, it takes both courage and imagination to be an early adopter. That necessitates buy-in at the executive level, which means acknowledging that consumer insights are a blind spot and that working with this kind of data is something different than business-as-usual.
That could be a sensitive undertaking for a senior manager like Jane Scott, vice president for Marketing of Imports at Freixenet USA, who admits she was “a little worried it would be too techie” when she presented initial findings at a national company meeting earlier this year. In addition, Scott’s presentation came at the tail end of a seven-hour day filled with marketing presentations.
“It turned out they were fascinated,” said Scott, “and very excited based on the feedback I got. They are excited to hear more.”
Navigating the interface, and digging in to the nuances of particular markets, labels, and price categories is the responsibility of brand manager, Danielle Fritz. “We don’t have a lot of access to data so we definitely wanted to get as much as possible out of this opportunity,” she said.
- If you are interested in finding out more about how Enolytics could work with you and use consumer data to unpick new trends and opportunities for your business then contact Cathy Huyghe at cathy@enolytics.com, or follow on Twitter and Instagram at @cathyhuyghe and go to the Enolytics website.

