Every wine might taste different, but they also look different too, according to Wine Luthier, which has based its new technology tool on visualising tasting notes.
Tell you tell us your background and why you started up Wine Luthier?
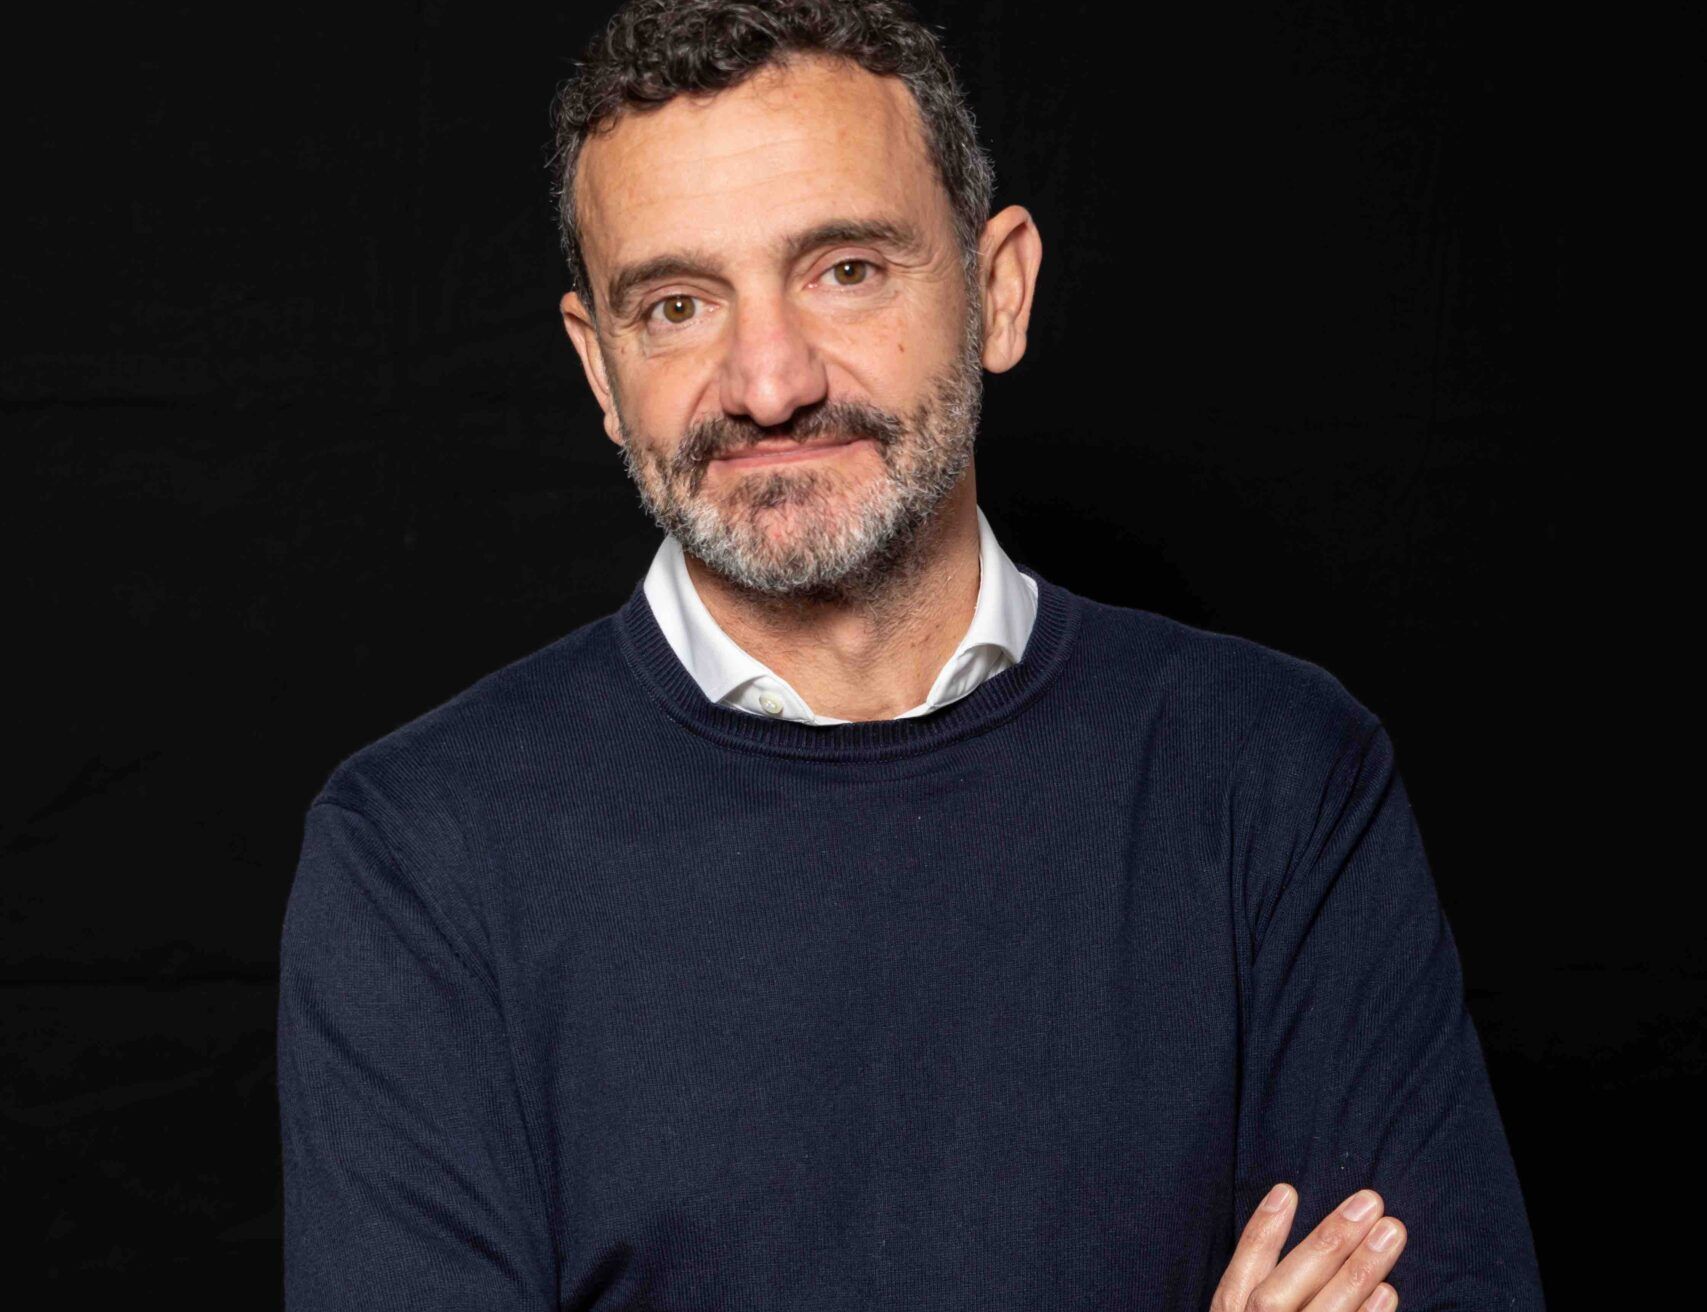
I am a winemaker from Valencia with over 20 years of experience in viticulture, winemaking and selling wine into the market as a buyer for European importers working with supermarkets.
The idea for Wine Luthier came about based on what happens when I taste a wine. I immediately a different shape in my head of what that wine tastes like. I know this because not what everyone else sees what I see, and it made me wonder if there was something rather special about that? Humans are thought to subconsciously name and remember each object it visualises and not what other senses perceive.
It made me realise that oenology can’t just work based on our own subjective criteria of taste and that data analysis, mathematics and data science also have to be used. To help me better understand how this might work I got in contact with professionals in the fields of mathematics computer science, and physical and chemical analysis.
That’s how Wine Luthier was created. It’s a unique technology that, after eight years of research, has allowed us to build up a database made up of thousands and thousands of wines that allows you, using quantifiable physical and chemical data, to draw the taste of a wine.
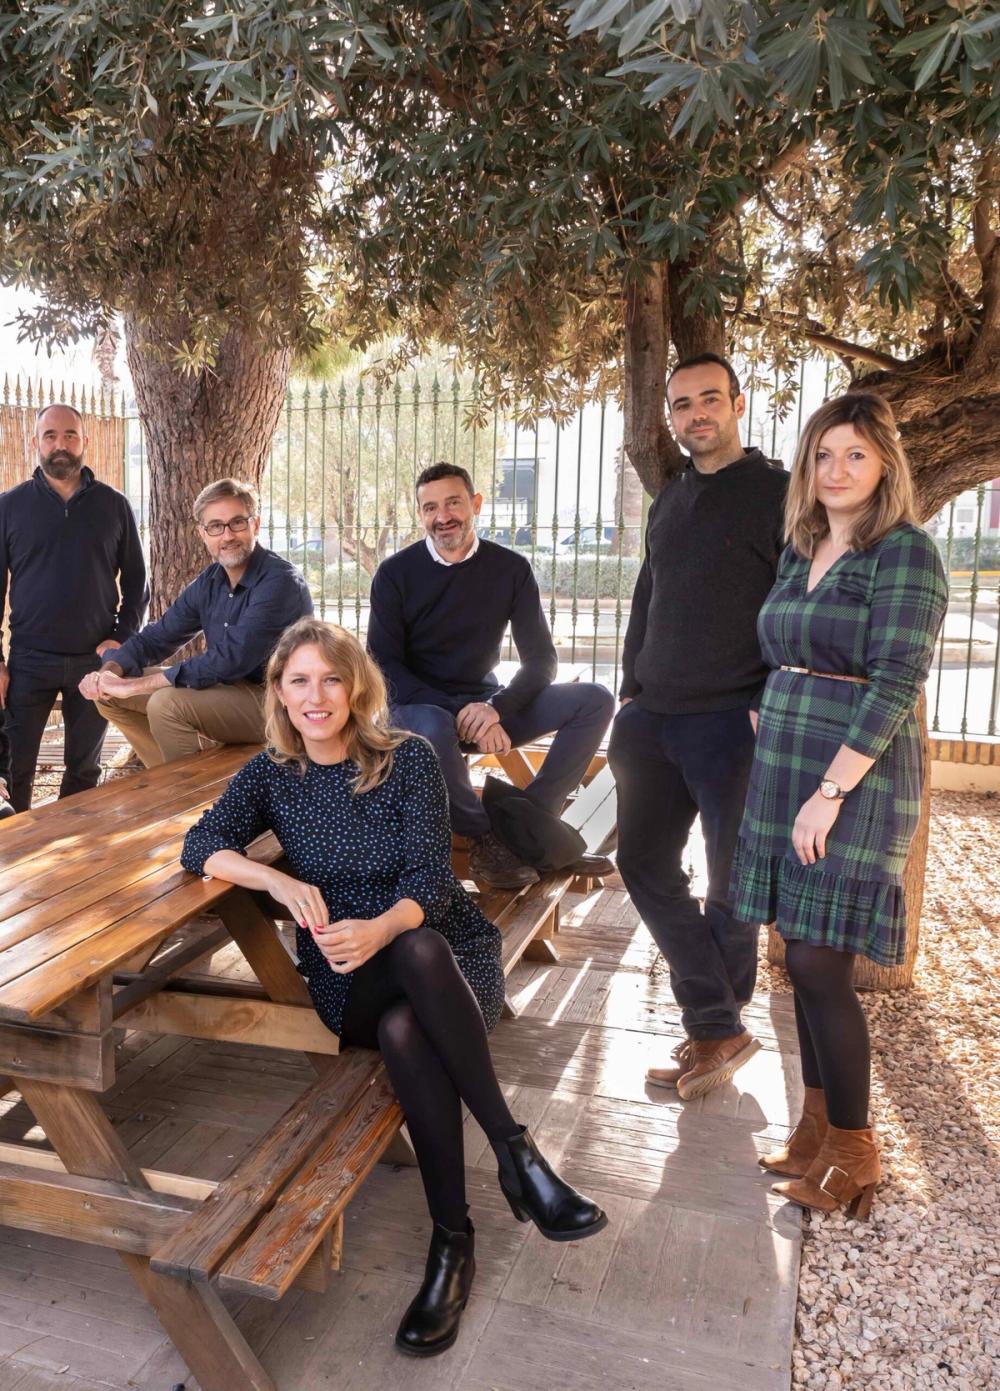
The team behind Wine Luthier
What is the main objective of Wine Luthier and the technology you are offering?
Wine Luthier is essentially a technology company that has achieved what seemed impossible. The ability to draw the shape and volume of taste, based purely on physical and chemical data. Wine Luthier’s role is to simplify what is clearly such a complex process.
It is a unique technology for the wine sector, to help it mitigate risks, improve quality controls, provide solutions and improve the processes that wine businesses can use to help make them more profitable and retain more consumers.
How have you been able to develop the technology to assess people’s taste by image?
Taste is essentially the human ability to recognise different flavours. We all know the taste we enjoy and prefer, but few people can define it objectively and consistently.
We have identified the four main taste drivers of a wine: crisp; mellow; sweet; and grip. Our exclusive algorithms turn raw analytical data into an accurate picture of the taste of any given wine.
What does each drawing tell you about a specific wine – can you give some examples of what a drawing might look for different styles of wines?
Here are some polygons explained:

What use is having someone’s tasting note as a drawing?
We can make an objective and precise analysis of anyone’s particular taste of a wine. Oenologists usually base their criteria on their own subjective opinion. We give them a tool to improve their work, but also combine it with sales and other data to help them compile far more relevant information that they can use to help in making wine, marketing and then selling it.
The taste of the wine to be bottled can then be compared with the taste of the target wine (a previous vintage, a previous lot, a specific wine reference). This helps determine the exact difference between both tastes and, if desired, the oenological path to make the difference imperceptible to a consumer. For example, the larger the shape, the greater the taste intensity, then more value for money.
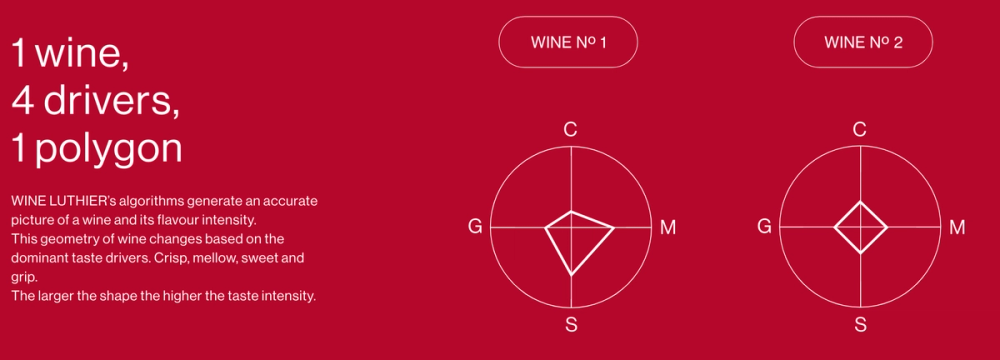
Here’s how the Wine Luthier algorithms work to create a unique diagram for each wine in its database based on how it tastes
Where does the name come from?
Wine Luthier takes its name as a homage to the wine producer (Wine) and the tuner and instrument maker (Luthier). As the name indicates, we have created an instrument that can offer objective information about a wine to oenologists and winemakers, as well as to wine retailers, giving them the tools to better refine their work.
We don´t say whether a wine is good or bad, because that depends on the emotional response of each individual consumer. What we do is draw the taste of the wine individually. We compare it with benchmarked wines in the market and consumer trends. In this way we allow producers and retailers to use our information to know exactly what types of wines they should offer to consumers.
What are you using these drawings to do when talking to potential customers?
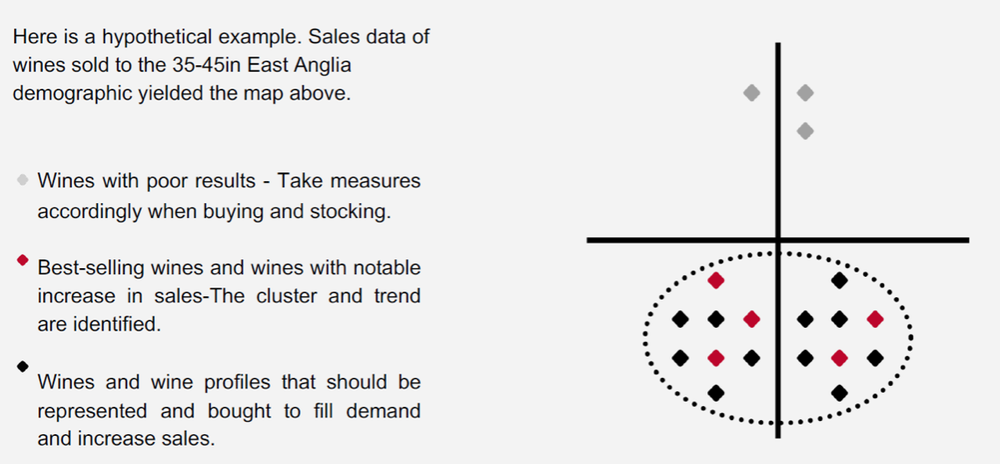
We first create what we call a Wine Positioning SystemTM (WPS) map – a bit like having GPS coordinates, but for wines. We can then use that WPS to:
- Create groups of wines with a similar profile.
- Understand what demographic group enjoys what type of wine.
- Safely recommend a wine in the same quadrant.
- Be able to recommend something slightly different and explain the difference.
- Offer a multitude of other applications that the client may need.
Here are some examples of how that might be used with these case studies.

You are also using this technology to analyse soil conditions and climate change? How does that work and what do you hope to do with the technology?
We have an agreement with the Rubio-Yeramian Laboratory of Aranda de Duero. With this collaboration we use their MosaicTM technology to cross our WPS and wine polygons with the climatic and edaphic metadata of the production areas, establishing an accurate relationship between soil-climate-wine style.
We then monitor the climate of the vintage and can predict the style of wine that will be made based on the weather conditions and what changes will happen to that style if the weather changes.
How do you see the technology developing and what uses do you have for it?
We are also developing an API for online distributors which will be ready by September. This API gives detailed information including which wines are similar, the exact percentage difference between two wines and at which point this difference is likely to be perceived by the average consumer.
It is also a precise method for recommending wines to customers according to their true individual taste preferences.
We are developing an app that will make the tool available to the end consumer. This will enable anyone to scan a wine list of a restaurant, or the wines on a supermarket shelf and Wine Luthier will tell you which one you will like the most.
In the future we would like to get into food analysis, and see how we can help in food production too, but out initial focus is on wine.
Do you think by working with more clients you will be able to see what needs they have and then improve what you can offer the trade?
Yes, because the more information we have from each wine every year, the more information we will be able to compare, which, in turn, will make our AI more precise. We are currently working with one of the largest wine distributors in Europe, amongst others.
We are confident this is a tool that will improve the consumer experience and their loyalty towards particular wines like never before. It also gives winemakers and distributors access to data and information that helps them make the right decisions about the wines they need to make.
- If you would like to read more about Wine Luthier go to its website here.
- To find out how you can work with Wine Luthier contact Pilar Rodriguez-Irizábal Comenge, chief marketing officer on pric@wineluthier.com.
