If a particular style of wine is selling as well in Shanghai as it is San Francisco or Sheffield, then that’s a wine trend we all need to take notice of, says Wine Business Solutions (WBS) Peter McAtamney.
So often we hear that there is no serious data available in the on-trade that really helps the hospitality sector, and the drinks distributors that supply it, really understand what the major global trends are that are shaping the future of the wine industry. Wine Business Solutions (WBS) has, however, been closely tracking the on-premise channel globally for more than 10 years. With the recent release of our analysis of the German market, WBS now has six of the seven largest markets for imported wine covered.
We’re not talking about the natural wine phenomenon, or organic, biodynamic wines, low alcohol wines, or wine in cans, kegs and so on, about which there is an unending stream of articles. We’re talking about the major gear shifts that affect every single wine business profoundly.
Wine prices around the world
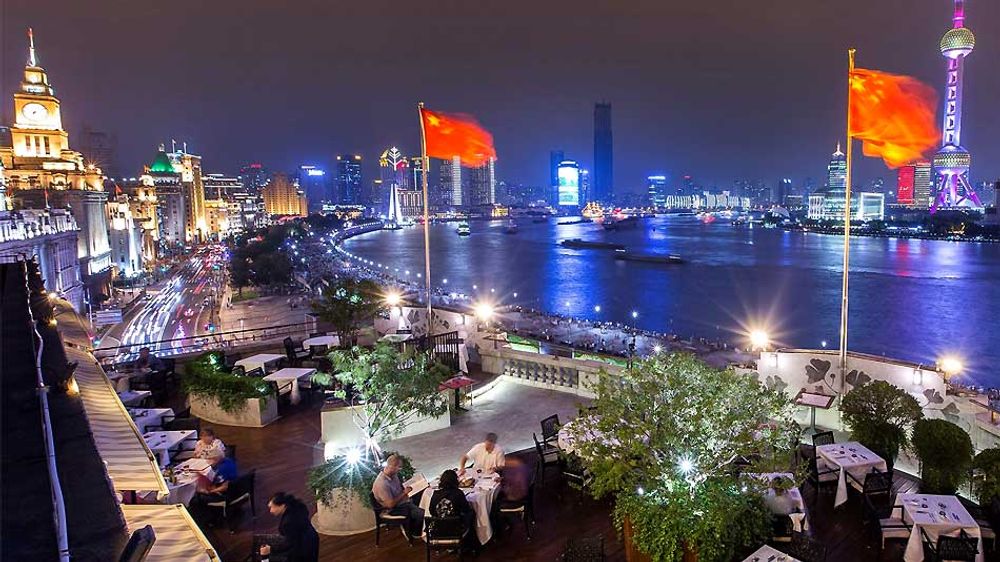
Wine in restaurants in China are by far the most expensive in the world
Markets, and the cities within them, do, of course, move at very different rates. That’s what makes this analysis so interesting. For example, right now, we can say the Chinese restaurant market is the most heavily brand orientated on earth.
There is a myriad of reasons for that, but go into any high-end retailer or open a wine list in any good restaurant and there you will see the world’s best representation of the world’s best wine brands. Despite all the current challenges, the long-term prospects for the Chinese market, therefore, look extremely good.
At the other end of the spectrum, 20% of wine listings in the UK, representing perhaps 40% of volume, are at a global retail price equivalent and quality level that simply doesn’t exist on wine lists in other markets.
This, of course, is the effect and impact of tax and duties. But it poses a major threat to the wine category, not just in the UK but internationally as well, as certain influential wine critics believe that this is reflective of the global market.
The Average Price of a Bottle of Wine on a Wine List by Market
- UK $44.74
- Canada $50.64
- Australia: $54.77
- Germany: $61.25
- The US: $74.63
- China: $233.94
But where are mature markets at otherwise and how can we be confident that this change is happening?
We started predicting that the next step in evolution would be wines with a great heritage story about seven years ago. Nothing could have prepared us, however, for the extent to which Italian wines have conquered all.
The Share of Listings of Wine Countries in Key Markets: The UK, Canada, US and Australia (WBS)
The UK
UK Country
2018
2015
CHG
France
28.8%
29.3%
-2%
Italy
24.1%
20.3%
19%
Spain
11.5%
8.7%
32%
Chile
7.5%
9.3%
-19%
Australia
5.7%
7.5%
-24%
South Africa
5.6%
6.2%
-10%
New Zealand
4.9%
4.9%
0%
Argentina
4.7%
3.5%
34%
USA
3.2%
4.4%
-27%
Portugal
1.6%
1.6%
0%
Canada
CCanaa Country
2018
2013
CHG
Italy
27.0%
18.8%
44%
France
17.7%
20.1%
-11.6%
Canada
15.9%
18.4%
-13.7%
USA
14.6%
15.5%
-5.5%
Spain
6.1%
4.1%
47.1%
Australia
4.2%
7.9%
-46.5%
Argentina
3.7%
3.7%
1.8%
New Zealand
3.5%
3.2%
10.1%
Chile
1.9%
4.0%
-51.7%
Portugal
1.4%
1.2%
14.8%
South Africa
1.1%
1.0%
17.8%
Germany
1.1%
1.0%
5.0%
Greece
0.4%
0.6%
-34.7%
Austria
0.4%
0.2%
68.5%
Others
0.4%
0.4%
27.3%
United States
USA Country
2018
2017
CHG
USA
40.2%
47.6%
-15%
Italy
26.1%
17.4%
50%
France
12.2%
15.2%
-20%
Spain
5.9%
4.9%
20%
Argentina
4.6%
4.0%
14%
New Zealand
2.9%
2.9%
2%
Germany
2.1%
2.1%
4%
Australia
1.3%
1.7%
-25%
Chile
1.0%
1.2%
-19%
Portugal
1.0%
0.5%
100%
Austria
0.9%
1.0%
-12%
Others
0.7%
1.0%
-29%
South Africa
0.6%
0.7%
-6%
Australia
AUS Region
2018
2017
CHG
SA
29.7%
26.1%
14%
VIC
14.0%
16.3%
-14%
Italy
10.7%
8.1%
32%
France
10.1%
11.0%
-9%
WA
9.8%
11.1%
-11%
New Zealand
7.5%
7.4%
2%
NSW
5.5%
5.1%
8%
OI
3.9%
4.2%
-8%
TAS
3.5%
3.7%
-6%
Spain
2.7%
2.7%
2%
SEA
2.5%
4.0%
-38%
QLD
0.1%
0.2%
-56%
When you see this sort of quantum change in the market, as an analyst, the first thing you do is doubt the numbers. Then you doubt yourself. When we looked at the data for 2019, however, Italy held share in all markets and even overtook France in the UK for the first time ever.
We were, therefore, very interested to see what the situation for Italian wine would be in a big wine producing country like German. Again our findings showed that Italy now has 33% share of all wine lists in Germany, more so than German wines at 31% and French wines at 17%.
Classic Italian regions like Soave have helped transform Italian wine sales in restaurants around the world says WBS
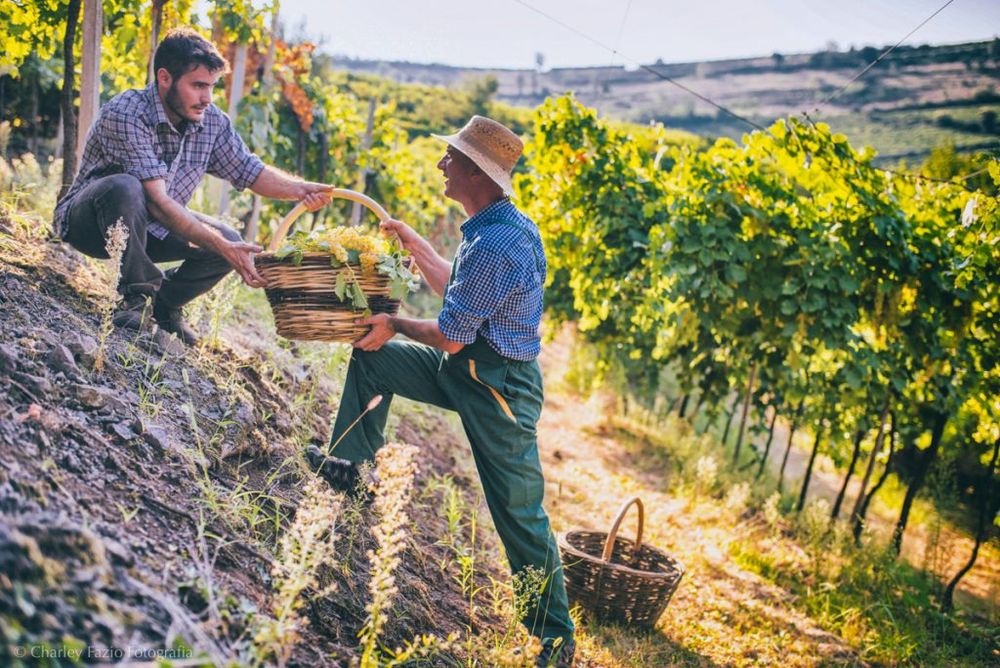
It might be tempting to think that this must be all about Prosecco, Pinot Grigio and rosé. But it’s not. That was 10 years ago. All regions of Italy can be found on wine lists all over the world.There are many factors contributing to the success but mostly it is about the styles of the wines themselves.
They are what restaurants and their customers want. Textural, interesting white wines and savoury, elegant medium weight red wines that really work with food.
Yes, there has been a complete revolution in viticulture and winemaking in Italy. Yes, there is a bit of a love story where world travellers and the idealised Italy are concerned. But you don’t go from not being able to sell obscure grape varieties from unknown regions to suddenly having no problem without some help.
What’s changing?
So, how has the market changed to enable Italy’s staggering success ?
If we go back to our age of beverage wine, those of you who can remember back that far will recall that when you went into your average restaurant in the UK, they had Chablis, they had Claret, they had Burgundy. They wouldn’t necessarily tell you from whom let alone what vintage. You were supposed to trust the restaurant and, unless it was a particularly reputable one, you probably couldn’t.
The New World then emerged with its reliable quality branded wine and people would order those wines in restaurants regardless of how poorly suited most of them were where fine cuisine was concerned.
Next, restaurant goers discovered the clean fresh flavours of cool climate wine and, for example, New Zealand stole 40% of Australia’s domestic market for white wineBy around 2010 the tide had turned. All of those straight-forward fruity flavours gave way to wines with more interest, elegance and finesse. Europe’s great regions and associated brands prospered. By the late 2010s restaurants globally started seeking out more value and Italy began to shine. They could never have sold to these customers, however, without a fundamental shift in market sophistication.
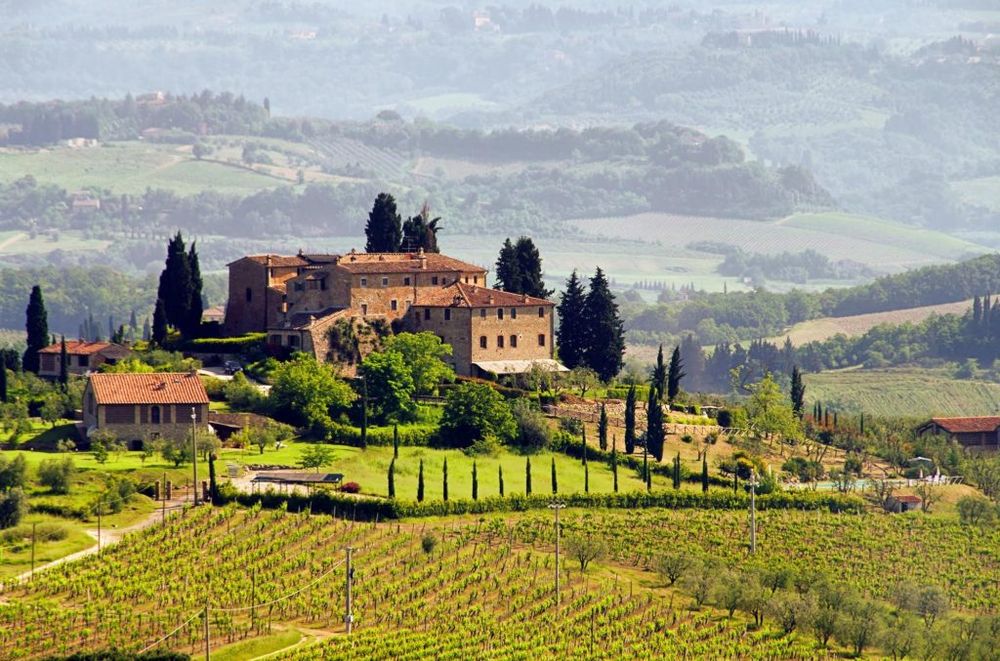
Consumers feel more comfortable when ordering wine now as they are so far more familiar with regions such as Tuscany
Ten years ago, you were given a wine list and supposed to choose a wine. This was an insane idea as the mathematical probability of knowing a wine, from a particular vintage, from a producer who might reside almost anywhere on earth, is next to zero. What has happened since is that the average restaurant is now confident enough to have a staff member chose the wine and talk about it. Customers now rely upon the restaurant to control the experience.
So, we have travelled full circle but this time around, customers can generally trust the restaurant and the restaurants need to provide a world class experience in order to keep that trust.
This is contributing to what Wine Intelligence talk about when they say that consumers are becoming less knowledgeable and less engaged. They don’t have to be as restaurants (and apps for that matter) are doing more of the heavy lifting for them.
In this way, and as the world’s best fine wine producers understand, this is not quite as bad as it sounds. Consumers shouldn’t have to bear the burden of insufferable complexity but rather just get on with enjoying ever more eclectic and interesting wine.
With this increased level of sophistication, you would expect people to be paying more, right?
We have certainly seen this is Australia and we expected to see it in other mature markets. When we looked more closely at the UK, Canada and the US, however, the average price and the mode price (that which occurs most often) have barely changed in the last three to five years.
You know instinctively when you see this that something has to be wrong. A complete inability to shift prices would mean much higher rates of restaurant failure than those that we are seeing now.
Rank
2016
Share
2019
Share
1
40
3.3%
40
4.3%
2
36
3.0%
48
4.0%
3
30
2.9%
60
3.5%
4
32
2.8%
36
3.2%
5
48
2.5%
38
3.2%
6
38
2.4%
45
3.2%
7
45
2.3%
42
3.0%
8
28
2.2%
50
2.8%
9
60
2.0%
32
2.7%
10
42
1.9%
52
2.5%
25.2%
32.3%
Share of Listings in Germany by Price Point (WBS)
Digging deeper

$40 is the key price point now in most US restaurants says WBS
As with any research, the real value comes from digging deeper.
If we take the US, for example, we use a massive database there of 72,000 listings when comparing any two annual periods. We can, therefore, be very confident about headline numbers like average and mode prices.
Between 2016 and 2019, the average price barely changed. The mode price (most popular) hadn’t changed at all – $40 is what the average American is most comfortable paying for a bottle of wine in a restaurant.
This is a nice number for any sort of wine producer anywhere, but no price is a good price if you become locked into it and don’t you don’t intend to grow your business significantly. Soon, your costs will eat you.
We then did an analysis of the most listed prices in the US. It turns out that the lack of change in the average price is due mostly to the delisting on ultra high priced wines. Restaurants would naturally be reluctant to mess with that $40 most popular price but you can see that, underneath that, all of the least expensive prices amongst the Top 10 (other than $38) were less listed in 2019 than they were in 2016 and all of the most expensive were more listed.
To simplify things, a restaurant would make 11% more selling a bottle at each one of the top ten prices in 2019 than they would in 2016. Added to that, those top ten price points were almost a third of all listing in 2019 versus only a quarter is 2016. Armed with that kind of information, suppliers would have a supreme advantage.
- If you would like to find out more about this report and others from Wine Business Solutions then contact its principal, Peter McAtamney at peter@winebusinesssolutions.com.au.
- You can also go to this link to access the reports as well as relevant report extracts.